Revisiting IT Policy #2: Campus DMCA Notices
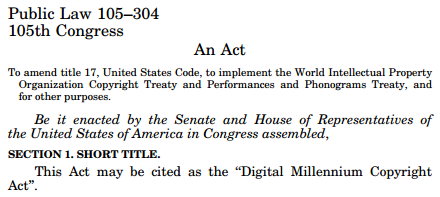
Under certain provisions from the Digital Millennium Copyright Act, copyright holders send a “notification of claimed infringement” (sometimes called a “DMCA” or “takedown” notice) to Internet service providers, such as college or university networks, when they find infringing material available from the provider’s network. I analyzed counts of infringement notices from the four principal senders to colleges and universities over three time periods (Nov 2011-Oct 2012, Feb/Mar 2013, and Feb/Mar 2014).
In all three periods, most campuses received no notices, even campuses with dormitories. Among campuses receiving notices, the distribution is highly skewed: a few campuses account for a disproportionately large fraction of the notices. Five campuses consistently top the distribution in each year, but beyond these there is substantial fluctuation from year to year.
The volume of notices sent to campuses varies somewhat positively with their size, although some important and interesting exceptions keep the correlation small. The incidence of detected infringement varies strongly with how residential campuses are. It varies less predictably with proxy measures of student-body affluence.
I elaborate on these points below.
Patterns
The estimated total number of notices for the twelve months ending October 2012 was 243,436. The actual number of notices in February/March 2013 was 39,753, and the corresponding number a year later was 20,278.
The general pattern was the same in each time period.
- According to the federal Integrated Postsecondary Education Data Service (IPEDS), from which I obtained campus attributes, there are 4,904 degree-granting campuses in the United States. Of these, over 80% received no infringement notices in any of the three time periods.
- 90% of infringement notices went to campuses with dormitories.
- Of the 801 institutions that received at least one notice in one period, 607 received at least one notice in two periods, and 437 did so in all three. The distribution was highly skewed among the campuses that received at least one infringement notice. The top two recipients in each period were the same: they alone accounted for 12% of all notices in 2012, and 10% in 2013 and 2014.
- In 2012, 10 institutions accounted for a third of all notices, and 41 accounted for two thirds. In 2013, the distribution was only a little less skewed: 22 institutions accounted for a third of all notices, and 94 accounted for two thirds. In 2014, 22 institutions also accounted for a third of all notices, and 99 accounted for two thirds.
Campus Type
In 2014, just 590 of the 4,904 campuses received infringement notices in 2014. Here is a breakdown by institutional control and type:
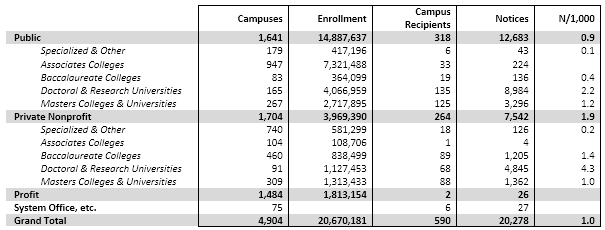
Here are the same data, this time broken down by campus size and residential character (using dormitory beds per enrolled student to measure the latter; the categories are quintiles):
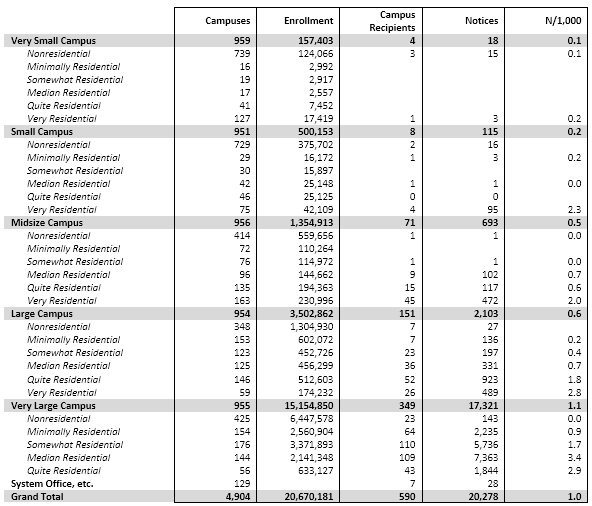
About a third of all notices went to very large campuses in the middle residential quintile. In keeping with the classic Pareto ratio, the largest 20% of campuses account for 80% of all notices (and enroll ¾ of all students). Although about half of the largest group is nonresidential (mostly community colleges, plus some state colleges), only a few of them received notices.
Campus Distributions
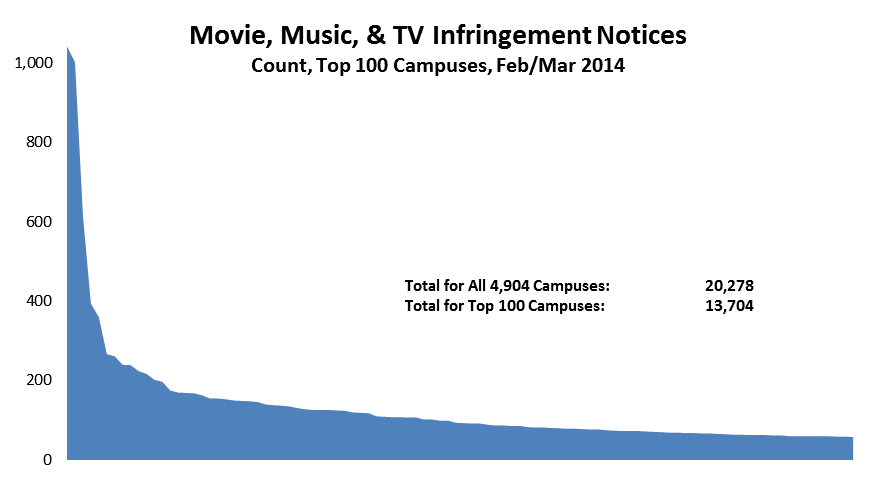
The top two among the 100 campuses that received the most notices in Feb/Mar 2014 received over 1,000 notices each in the two months. The next highest campus received 615. As the graph below shows, the top 100 campuses accounted for two thirds of the notices; the next 600 campuses accounted for the remaining third (click on this graph, or the others below, to see it full size):
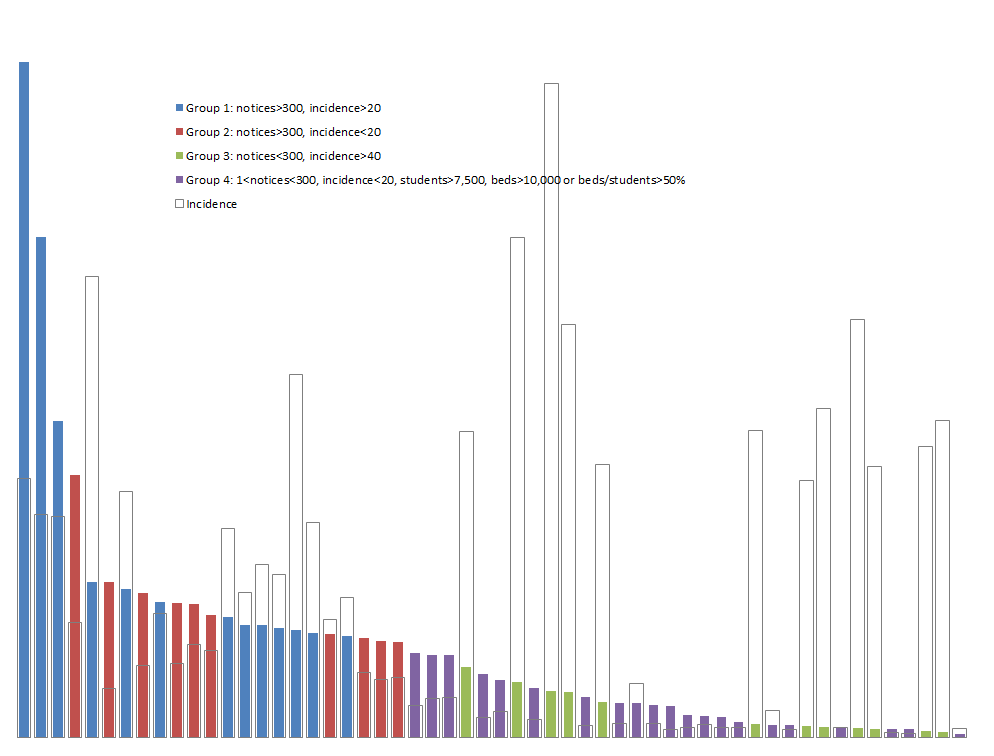
Below is a more detailed distribution for the top 30 recipient campuses, with comparisons to 2012 and 2013 data. To enable valid comparison, this chart shows the fraction of notices received by each campus in each year, rather than the total. The solid red bars are the campus’s 2014 share, and the lighter blue and green bars are the 2012 and 2013 shares. The hollow bar for each campus is the incidence of detected infringement, defined as the number of 2014 notices per thousand headcount students.
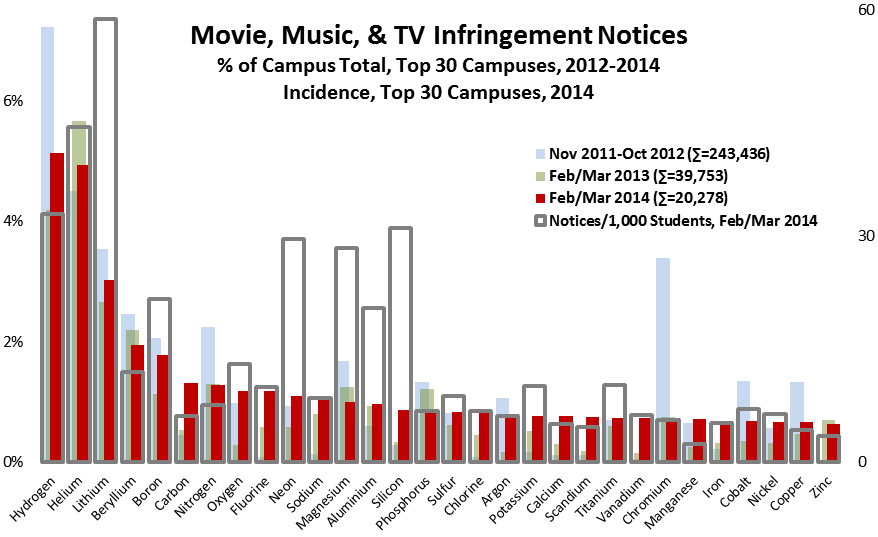
As in earlier analyses, there is an important distinction between campuses whose high volume of notices stems largely from their size, and those where it stems from a combination of size and incidence—that is, the ratio of notices received to enrollment.
In the graph, Carbon and Nitrogen are examples of the former: they are both very large public urban universities enrolling over 50,000 students, but with relatively low incidence of around 7 notices per thousand students. They stand in marked contrast to incidences of 20-60 notices per thousand students at Lithium, Boron, Neon, Magnesium, Aluminum, and Silicon, each of which enrolls 10-25,000 students—all private except Aluminum.
Changes over Time
The overall volume of infringement notices varies from time to time depending on how much effort copyright holders devote to searching for infringement (effort costs money), and to a lesser extent based on which titles they use to seed searches. The volume of notices sent to campuses varies accordingly. However, the distribution of notices across campuses should not be affected by the total volume. To analyze trends, therefore, it is important to use a metric independent of total volume.
As in the preceding section, I used the fraction of all campus notices each campus received for each period. The top two campuses were the same in all three years: Hydrogen was highest in 2012 and 2014, and Helium was highest in 2013.
Only five campuses received at least 1.5% of all notices in more than one year:
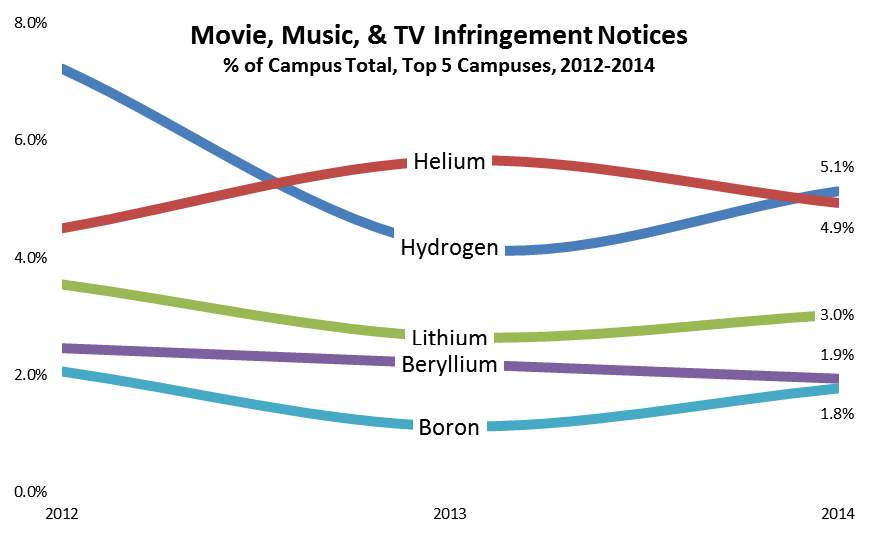
These campuses consistently stand at the top of the list, account for a substantial fraction of all infringement notices, and except for Beryllium have incidence over 20. As I argue below, it makes sense for copyright holders to engage them directly, to help them understand how different they are from their peers, and perhaps to persuade them to better “effectively combat” infringement from their networks by adopting policies and practices from their low-incidence peers.
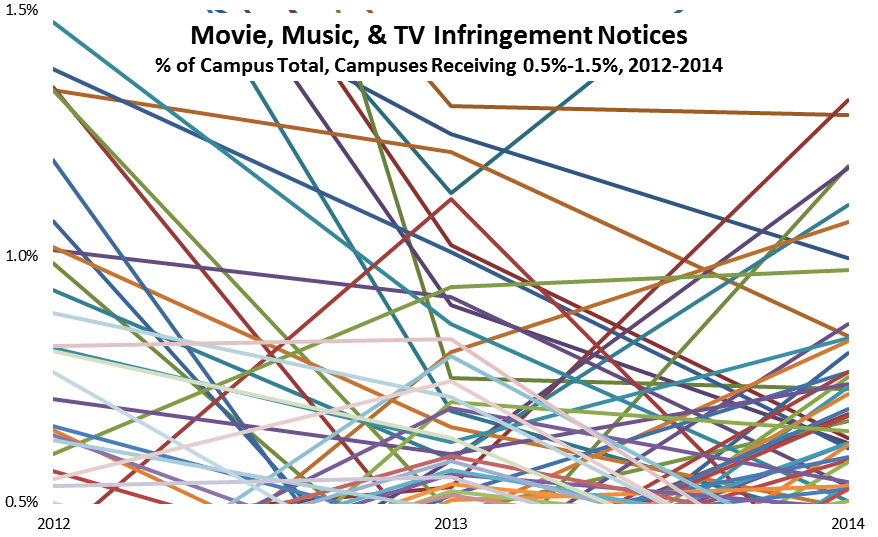
Aside from these five campuses, there is great year-to-year variation in how many notices campuses receive. Below, for example, is a similar graph for the approximately 50 campuses receiving 0.5%-1.5% of all notices in at least one of the three years. Such year-to-year variation makes engagement much more difficult to target efficiently and much less likely to have discernible effects.
Relationships
Size
All else equal, if infringement is the same across campuses and campuses take equally effective measures to prevent it from reaching the Internet, then the volume of detected infringement should generally vary with campus size. That this is only moderately the case implies that student behavior varies from campus to campus and/or that campuses’ “effectively combat” measures are different and have different effects.
Here are data for the 100 campuses receiving the most infringement notices in 2014:

It appears visually that the overall correlation between campus size and notice volume is modest (and indeed r=0.29) because such a large volume of notices went to Hydrogen and Helium, which are not the largest campuses.
However, the correlation is slightly lower if those two campuses are omitted. This is because Lithium has the next highest volume, yet is of average size, and Manganese, the largest campus in the group, with over 70,000 students, had very low incidence of 2 notices per thousand students. (I’ve spoken at length with the CIO and network-security head at Manganese, and learned that its anti-infringement measures comprise a full array of policies and practices: blocking of peer-to-peer protocols at the campus border, with well-established exception procedures; active followthrough on infringement notices received; and direct outreach to students on the issue.)
Residence
If students live on campus, then typically their network connection is through the campus network, their detectable infringement is attributed to the campus, and that’s where the infringement notice goes. If students live off campus, then they do not use the campus network, and infringement notices go to their ISP. This is why most infringement notices go to campuses with dorms, even though the behavior of their students probably resembles that of their nonresidential peers.
For the same reason, we might expect that residentially intensive campuses (measured by the ratio of dormitory beds to total enrollment) would have a higher incidence of detectable infringement, all else equal, than less residential campuses. Here are data for the 100 campuses receiving the most infringement notices:
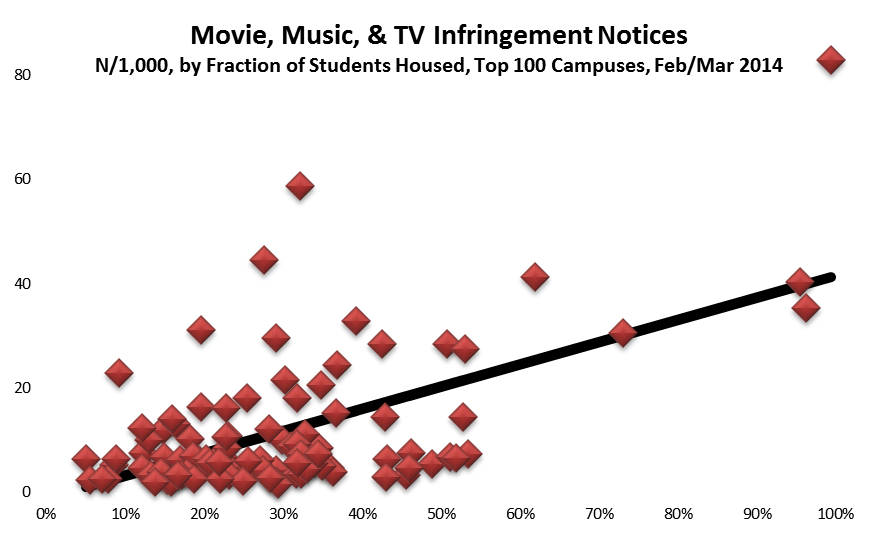
The relationship is positive, as expected, and relatively strong (r=.58). It’s important, though, to remember that this relationship between campus attributes (residential intensity and the incidence of detected infringement) does not necessarily imply a relationship between student attributes such as living in dorms and distributing infringing material. Drawing inferences about individuals from data about groups is the “ecological fallacy.”
Affluence
One hears arguments that infringement varies with affluence, that is, that students with less money are more likely to infringe. There’s no way to assess that directly with these data, since they do not identify individuals. However, IPEDS campus data include the fraction of students receiving Federal grant aid, which varies inversely with income. The higher this fraction, the less affluent, on average, the student body should be. So it’s interesting to see how infringement (measured by incidence rather than volume) varies with this metric:
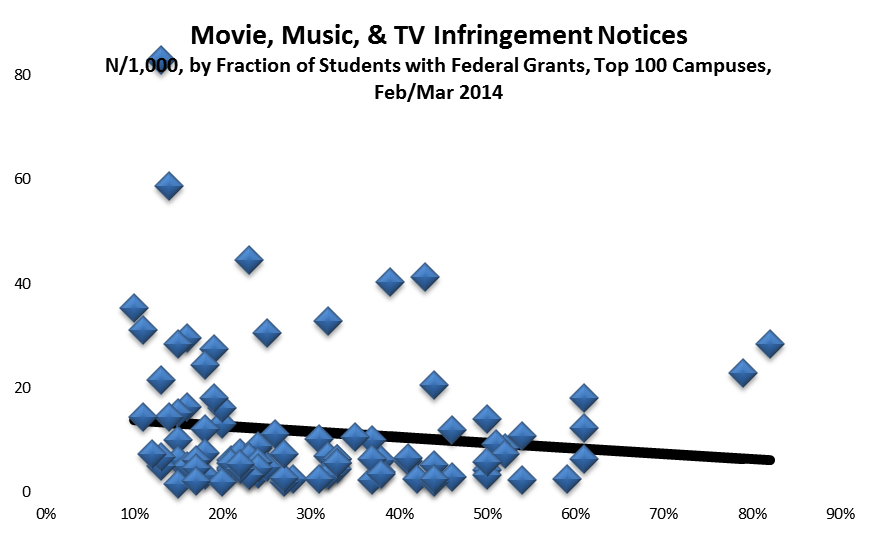
The relationship is slightly negative (r=-.12), in large part because of Polonium, a small private college with few financial-aid recipients that received 83 notices per 1000 students in 2014. (Its incidence was similar in 2012, but much lower in 2013.) Even without Polonium, however, the relationship is small.
For the same reason, we might expect a greater incidence of detected infringement on less expensive campuses. The data:
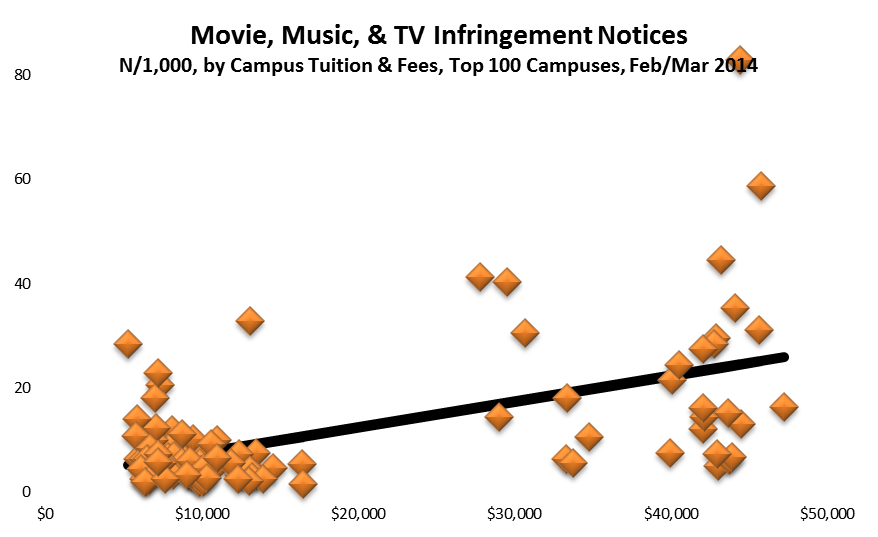
Once again the relationship is the opposite (r=.54), largely because most campuses have both low tuition and low incidence.
Campus Interactions
Following the 2012 and 2013 studies, I communicated directly with IT leaders at several campuses with especially high volumes of infringement notices. All save one (Hydrogen) of these interactions were informative, and several appear to have influenced campus policies and practices for the better.
- Helium. Almost all of Helium’s notices are associated with a small, consecutive group of IP addresses, presumably the external addresses for a NAT-mediated campus wireless network. I learned from discussions with Helium’s CIO that the university does not retain NAT logs long enough to identify wireless users when infringement notices are received; as a result, few infringement notices reach offenders, and so they have little impact directly or indirectly. Helium apparently understands and recognizes the problem, but replacing its wireless logging systems is not a high priority project.
- Hydrogen. Despite diverse direct, indirect, and political efforts to engage IT leaders at Hydrogen, I was never able to open discussions with them. I do not understand why the university receives so many notices (unlike Helium’s, they are not concentrated), and was therefore unable to provide advice to the campus. It is also unclear whether the notices sent to Hydrogen are associated with its small-city main campus or with its more urban branch campus.
- Krypton. Krypton used to provide guests up to 14 days of totally unrestricted and anonymous use of its wired and wireless networks. I believe that this led to its high rate of detected infringement. More recently, Krypton implemented a separate guest wireless network, which is still anonymous but apparently is either more restricted or is routed to an external ISP. I believe that this change is why Krypton is no longer in the top 20 group in 2014. (Krypton still offers unrestricted 14-day access to its wired network.)
- Lithium. The network-security staff at Lithium told me that there are plans to implement better filtering and blocking on their network, but that implementation has been delayed.
- Nitrogen. Nitrogen enrolls over 50,000 students, more than almost any other campus. As I pointed out above, although Nitrogen’s infringement notice counts are substantial, they are actually relatively low when adjusted for enrollment.
- Gallium. I discussed Gallium’s high infringement volume with its CIO in early 2013. She appeared to be surprised that the counts were so high, and that they were not all associated with Gallium affiliate campuses, as the university had previously believed. Although the CIO was noncommittal about next steps, it appears that something changed for the better.
- Palladium. The Palladium CIO attended a Symposium I hosted in March 2013, and while there he committed to implementing better controls at the University. The CIO appears to have followed through on this commitment.
- No Alias. Although it doesn’t appear in the graph, No Alias is an interesting story. It ranked very high in the 2012 study. NA, it turns out, provides exit connections for the Tor network, which means that some traffic that appears to originate at NA in fact originates from anonymous users elsewhere. Most of NA’s 2012 notices were associated with the Tor connections, and I suggested to NA’s security officer that perhaps No Alias might impose some modest filters on those. It appears that this may have happened, and may be why NA dropped out of the top group.
I also interacted with several other campuses that ranked high in 2013. In many of these conversations I was able to point IT staff to specific problems or opportunities, such as better configuring firewalls. Most of these campuses moved out of the top group.
And So…
The 2014 DMCA notice data reinforce earlier implications (from both data and direct interactions) for campus/industry interactions. Copyright holders should interact directly with the few institutions that rank consistently high, and with large residential institutions that rank consistently low. In addition, copyright holders should seek opportunities to better understand how best to influence student behavior, both during and after college.
Conversely, campuses that receive disproportionately many notices, and so give higher education a bad reputation with regard to copyright infringement, should consult peers at the other end of the distribution, and identify reasonable ways to improve their policies and practices.
9|4|14 gj-c
 The last time
  The word “transmit” is important, because it’s different from “send” and “receive”. Users connect computers, servers, phones, television sets, and other devices to networks. They choose and pay for the capacity of their connection (the “pipe”, in the usual but imperfect plumbing analogy) to send and receive network traffic. Not all pipes are the same, and it’s perfectly acceptable for a network to provide lower-quality pipes–slower, for example–to end users who pay less, and to charge customers differently depending on where they are located. But a neutral network must provide the same quality of service to those who pay for the same size, quality, and location of “pipe”.
 s also important to consider two different (although sometimes overlapping) kinds of users: “end users” and “providers”. In general, providers deliver services to end users, sometimes content (for example, Netflix, the New York Times, or Google Search), sometimes storage (OneDrive, Dropbox), sometimes communications (Gmail, Xfinity Connect), and sometimes combinations of these and other functionality (Office Online, Google Apps).
 Networks (and therefore network operators) can play different roles in transmission: “first mile”, “last mile”, “backbone”, and “peering”. Providers connect to first-mile networks. End users do the same to last-mile networks. (First-mile and last-mile networks are mirror images of each other, of course, and can swap roles, but there’s always one of each for any traffic.) Sometimes first-mile networks connect directly to last-mile networks, and sometimes they interconnect indirectly using backbones, which in turn can interconnect with other backbones. Peering is how first-mile, last-mile, and backbone networks interconnect.
 “Public” networks are treated differently than “private” ones. Generally speaking, if a network is open to the general public, and charges them fees to use it, then it’s a public network. If access is mostly restricted to a defined, closed community and does not charge use fees, then it’s a private network. The distinction between public and private networks comes mostly from the
  An early indicator was


 Old joke. Someone writes a computer program (creates an app?) that translates from English into Russian (say) and vice versa. Works fine on simple stuff, so the next test is a a bit harder: “the spirit is willing, but the flesh is weak.” The program/app translates the phrase into Russian, then the tester takes the result, feeds it back into the program/app, and translates it back into English. Result: “The ghost is ready, but the meat is raw.”
 But at least one campus, which I’ll call Pi University, balked. The Campus Agreement, PiU’s golf-loving CIO pointed out, had a provision no one had read carefully: if PiU withdrew from the Campus Agreement, he said, it might be required to list and pay for all the software copies that PiU or its students, faculty, and staff had acquired under the Campus Agreement — that is, to buy what it had been renting. The PiU CIO said that he had no way to comply with such a provision, and that therefore PiU could not in good faith sign an agreement that included it.
 According to the
  Over the past few years this changed, first gradually and then more abruptly.
 The CIO from one campus — I’ll call it Omega University — discovered that a recent renewal of the bookstore contract provided that during the 15-year term of the contract, “the Bookstore shall be the University’s …exclusive seller of all required, recommended or suggested course materials, course packs and tools, as well as materials published or distributed electronically, or sold over the Internet.” The OmegaU CIO was outraged: “In my mind,” he wrote, “the terms exclusive and over the Internet can’t even be in the same sentence! And to restrict faculty use of technology for next 15 years is just insane.”