“Why are you at NBC?,” people ask. “What are you doing over there?,” too, and “Is it different on the dark side?” A year into the gig seems a good time to think about those. Especially that “dark side” metaphor. For example, which side is “dark”?
This is a longer-than-usual post. I’ll take up the questions in order: first Why, then What, then Different; use the links to skip ahead if you prefer.
Why are you at NBC?
 This is the first time I’ve worked at a for-profit company since, let’s see, the summer of 1967: an MIT alumnus arranged an undergraduate summer job at Honeywell‘s Mexico City facility. Part of that summer I learned a great deal about the configuration and construction of custom control panels, especially for big production lines. I think of this every time I see photos of big control panels, such as those at older nuclear plants—I recognize the switch types, those square toggle buttons that light up. (Another part of the summer, after the guy who hired me left and no one could figure out what I should do, I made a 43½-foot paper-clip chain.)
One nice Honeywell perk was an employee discount on a Pentax 35mm SLR with a 40mm and 135mm lenses, which I still have in a box somewhere, and which still works when I replace the camera’s light-meter battery. (The Pentax brand belonged to Honeywell back then, not Ricoh.) Excellent camera, served me well for years, through two darkrooms and a lot of Tri-X film. I haven’t used it since I began taking digital photos, though.
 I digress. Except, it strikes me, not really. One interesting thing about digital photos, especially if you store them online and make most of them publicly visible (like this one, taken on the rim of spectacular Bryce Canyon, from my Backdrops collection), is that sometimes the people who find your pictures download them and use them for their own purposes. My photos carry a Creative Commons license specifying that although they are my intellectual property, they can be used for nonprofit purposes so long as they are attributed to me (an option not available, apparently, if I post them on Facebook instead).
So long as those who use my photos comply with the CC license requirement, I don’t require that they tell me, although now and then they do. But if people want to use one of my photos commercially, they’re supposed to ask my permission, and I can ask for a use fee. No one has done that for me—I’m keeping the day job—but it’s happened for our son.
 I hadn’t thought much about copyright, permissions, and licensing for personal photos (as opposed to archival, commercial, or institutional ones) back when I first began dealing with “takedown notices” sent to the University of Chicago under the Digital Millennium Copyright Act (DMCA). There didn’t seem to be much of a parallel between commercialized intellectual property, like the music tracks that accounted for most early DMCA notices, and my photos, which I was putting online mostly because it was fun to share them.
Neither did I think about either photos or music while serving on a faculty committee rewriting the University’s Statute 18, the provision governing patents in the University’s founding documents.
 The issues for the committee were fundamentally two, both driven somewhat by the evolution of “textbooks”.
First, where is the line between faculty inventions, which belong to the University (or did at the time), and creations, which belong to creators—between patentable inventions and copyrightable creations, in other words? This was an issue because textbooks had always been treated as creations, but many textbooks had come to include software (back then, CDs tucked into the back cover), and software had always been treated as an invention.
Second, who owns intellectual property that grows out of the instructional process? Traditionally, the rights and revenues associated with textbooks, even textbooks based on University classes, belonged entirely to faculty members. But some faculty members were extrapolating this tradition to cover other class-based material, such as videos of lectures. They were personally selling those materials and the associated rights to outside entities, some of which were in effect competitors (in some cases, they were other universities!).
 As you can see by reading the current Statute 18, the faculty committee really didn’t resolve any of this. Gradually, though, it came to be understood that textbooks, even textbooks including software, were still faculty intellectual property, whereas instructional material other than that explicitly included in traditional textbooks was the University’s to exploit, sell, or license.
With the latter well established, the University joined Fathom, one of the early efforts to commercialize online instructional material, and put together some excellent online materials. Unfortunately, Fathom, like its first-generation peers, failed to generate revenues exceeding its costs. Once it blew through its venture capital, which had mostly come from Columbia University, Fathom folded. (Poetic justice: so did one of the profit-making institutions whose use of University teaching materials prompted the Statute 18 review.)
Gradually this all got me interested in the thicket of issues surrounding campus online distribution and use of copyrighted materials and other intellectual property, and especially the messy question how campuses should think about copyright infringement occurring within and distributed from their networks. The DMCA had established the dual principles that (a) network operators, including campuses, could be held liable for infringement by their network users, but (b) they could escape this liability (find “safe harbor”) by responding appropriately to complaints from copyright holders. Several of us research-university CIOs worked together to develop efficient mechanisms for handling and responding to DMCA notices, and to help the industry understand those and the limits on what they might expect campuses to do.
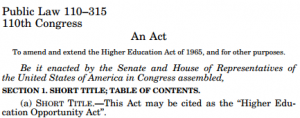 As one byproduct of that, I found myself testifying before a Congressional committee. As another, I found myself negotiating with the entertainment industry, under US Education Department auspices, to develop regulations implementing the so-called “peer to peer” provisions of the Higher Education Opportunity Act of 2008.
That was one of several threads that led to my joining EDUCAUSE in 2009. One of several initiatives in the Policy group was to build better, more open communications between higher education and the entertainment industry with regard to copyright infringement, DMCA, and the HEOA requirements.
 I didn’t think at the time about how this might interact with EDUCAUSE’s then-parallel efforts to illuminate policy issues around online and nontraditional education, but there are important relevancies. Through massively open online courses (MOOCs) and other mechanisms, colleges and universities are using the Internet to reach distant students, first to build awareness (in which case it’s okay for what they provide to be freely available) but eventually to find new revenues, that is, to monetize their intellectual property (in which case it isn’t).
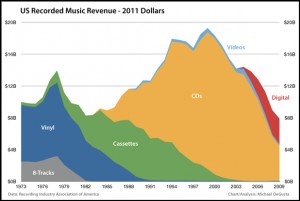 If online campus content is to be sold rather than given away, then campuses face the same issues as the entertainment industry: They must protect their content from those who would use it without permission, and take appropriate action to deter or address infringement.
Campuses are generally happy to make their research freely available (except perhaps for inventions), as UChicago’s Statute 18 makes clear, provided that researchers are properly credited. (I also served on UChicago’s faculty Intellectual Property Committee, which among other things adjudicated who-gets-credit conflicts among faculty and other researchers.) But instruction is another matter altogether. If campuses don’t take this seriously, I’m afraid, then as goes music, so goes online higher education.
Much as campus tumult and changes in the late Sixties led me to abandon engineering for policy analysis, and quantitative policy analysis led me into large-scale data analysis, and large-scale data analysis led me into IT, and IT led me back into policy analysis, intellectual-property issues led me to NBCUniversal.
 I’d liked the people I met during the HEOA negotiations, and the company seemed seriously committed to rethinking its relationships with higher education. I thought it would be interesting, at this stage in my career, to do something very different in a different kind of place. Plus, less travel (see screwup #3 in my 2007 EDUCAUSE award address).
So here I am, with an office amidst lobbyists and others who focus on legislation and regulation, with a Peacock ID card that gets me into the Universal lot, WRC-TV, and 30 Rock (but not SNL), and with a 401k instead of a 403b.
What are you doing over there?
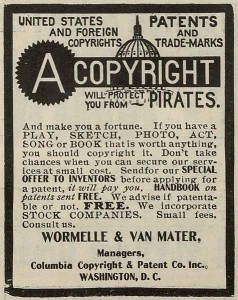
NBCUniversal’s goals for higher education are relatively simple. First, it would like students to use legitimate sources to get online content more, and illegitimate “pirate” sources less. Second, it would like campuses to reduce the volume of infringing material made available from their networks to illegal downloaders worldwide.
 My roles are also two. First, there’s eagerness among my colleagues (and their counterparts in other studios) to better understand higher education, and how campuses might think about issues and initiatives. Second, the company clearly wants to change its approach to higher education, but doesn’t know what approaches might make sense. Apparently I can help with both.
To lay foundation for specific projects—five so far, which I’ll describe briefly below—I looked at data from DMCA takedown notices.
Curiously, it turned out, no one had done much to analyze detected infringement from campus networks (as measured by DMCA notices sent to them), or to delve into the ethical puzzle: Why do students behave one way with regard to misappropriating music, movies, and TV shows, and very different ways with regard to arguably similar options such as shoplifting or plagiarism? I’ve written about some of the underlying policy issues in Story of S, but here I decided to focus first on detected infringement.
 It turns out that virtually all takedown notices for music are sent by the Recording Industry Association of America, RIAA (the Zappa Trust and various other entities send some, but they’re a drop in the bucket).
 Most takedown notices for movies and some for TV are sent by the Motion Picture Association of America, MPAA, on behalf of major studios (again, with some smaller entities such as Lucasfilm wading in separately). NBCUniversal and Fox send out notices involving their movies and TV shows.
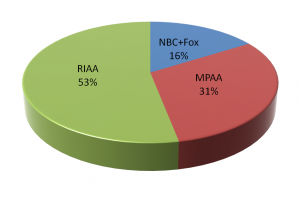 I’ve now analyzed data from the major senders for both a twelve-month period (Nov 2011-Oct 2012) and a more recent two-month period (Feb-Mar 2013). For the more recent period, I obtained very detailed data on each of 40,000 or so notices sent to campuses. Here are some observations from the data:
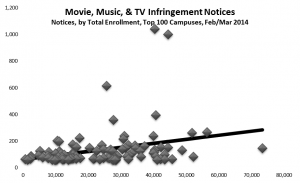
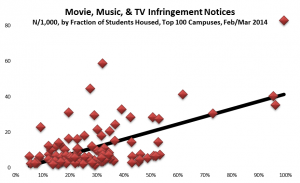
- Almost all the notices went to 4-year campuses that have at least 100 dormitory beds (according to IPEDS). To a modest extent, the bigger the campus the more notices, but the correlation isn’t especially large.
- Over half of all campuses—even of campuses with dorms—didn’t get any notices. To some extent this is because there are lots and lots of very small campuses, and they fly under the infringement-detection radar. But I’ve learned from talking to a fair number of campuses that, much to my surprise, many heavily filter or even block peer-to-peer traffic at their commodity Internet border firewall—usually because the commodity bandwidth p2p uses is expensive, especially for movies, rather than to deal with infringement per se. Outsourced dorm networks also have an effect, but I don’t think they’re sufficiently widespread yet to explain the data.
- Several campuses have out-of-date or incorrect “DMCA agent” addresses registered at the Library of Congress. Compounding that, it turns out some notice senders use “abuse” or other standard DNS addresses rather than the registered agent addresses.
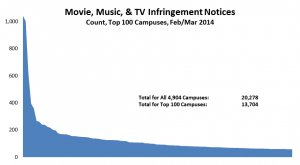
- Among campuses that received notices, a few campuses stand out for receiving the lion’s share, even adjusting for their enrollment. For example, the top 100 or so recipient campuses got about three quarters of the total, and a handful of campuses stand out sharply even within that group: the top three campuses (the leftmost blue bars in the graph below) accounted for well over 10% of the notices. (I found the same skewness in the 2012 study.) With a few interesting exceptions (interesting because I know or suspect what changed), the high-notice groups have been the same for the two periods.
 The detection process, in general, is that copyright holders choose a list of music, movie, or TV titles they believe likely to be infringed. Their contractors then use BitTorrent tracker sites and other user tools to find illicit sources for those titles.
For the most part the studios and associations simply look for titles that are currently popular in theaters or from legitimate sources. It’s hard to see that process introducing a bias that would affect some campuses so much differently than others. I’ve also spent considerable time looking at how a couple of contractors verify that titles being offered illicitly (that is, listed for download on a BitTorrent tracker site such as The Pirate Bay) are actually the titles being supplied (rather than, say, malware, advertising, or porn), and at how they figure out where to send the resulting takedown notices. That process too seems pretty straightforward and unbiased.
 Sender choices clearly can influence how notice counts vary from time to time: for example, adding a newly popular title to the search list can lead to a jump in detections and hence notices. But it’s hard to see how the choice of titles would influence how notice counts vary from institution to institution.
This all leads me to believe that takedown notices tell us something incomplete but useful about campus policies and practices, especially at the extremes. The analysis led directly to two projects focused on specific groups of campuses, and indirectly to three others.
Role Model Campuses
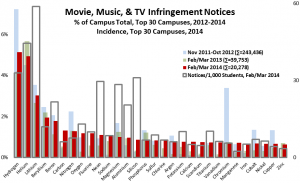
Based on the results of the data analysis, I communicated individually with CIOs at 22 campuses that received some but relatively few notices: specifically, campuses that (a) received at least one notice (and so are on the radar) but (b) fewer than 300 and fewer than 20 per thousand student headcount, (c) have at least 7,500 headcount students, and (d) have at least 10,000 dorm beds (per IPEDS) or sufficient dorm beds to house half your headcount. (These are Group 4, the purple bars in the graph below. The solid bars represent total notices sent, and the hollow bars represent incidence, or notices per thousand headcount students. Click on the graph to see it larger.)
I’ve asked each of those campuses whether they’d be willing to document their practices in an open “role models” database developed jointly by the campuses and hosted by a third party such as 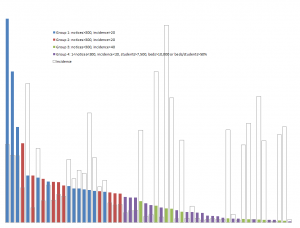 a higher-education association (as EDUCAUSE did after the HEOA regulations took effect). The idea is to make a collection of diverse effective practices available to other campuses that might want to enhance their practices.
High Volume Campuses
Separately, I communicated privately with CIOs at 13 campuses that received exceptionally many notices, even adjusting for their enrollment (Group 1, the blue bars in the graph). I’ve looked in some detail at the data for those campuses, some large and some small, and in some cases that’s led to suggestions.
For example, in a few cases I discovered that virtually all of a high-volume campus’s notices were split evenly among a small number of consecutive IP addresses. In those cases, I’ve suggested that those IP addresses might be the front-end to something like a campus wireless network. Filtering or blocking p2p (or just BitTorrent) traffic on those few IP addresses (or the associated network devices) might well shrink the campus’s role as a distributor without affecting legitimate p2p or BitTorrent users (who tend to be managing servers with static addresses).
Symposia
Back when I was at EDUCAUSE, we worked with NBCUniversal to host a DC meeting between senior campus staff from a score of campuses nationwide and some industry staff closely involved with the detection and notification for online infringement. The meeting was energetic and frank, and participants from both sides went away with a better sense of the other’s bona fides and seriousness. This was the first time campus staff had gotten a close look at the takedown-notice process since a Common Solutions Group meeting in Ann Arbor some years earlier; back then the industry’s practices were much less refined.
 Based on the NBCUniversal/EDUCAUSE experience, we’re organizing a series of regional “Symposia” along these lines on campuses in various cities across the US. The objectives are to open new lines of communication and to build trust. The invitees are IT and student-affairs staff from local campuses, plus several representatives from industry, especially the groups that actually search for infringement on the Internet. The first was in New York, the second in Minneapolis, the third will be in Philadelphia, and others will follow in the West, the South, and elsewhere in the Midwest.
Research
We’re funding a study within a major state university system to gather two kinds of data. Initially the researchers are asking each campus to describe the measures it takes to “effectively combat” copyright infringement: its communications with students, its policies for dealing with violations, and the technologies it uses. The data from the first phase will help enhance a matrix we’ve drafted outlining the different approaches taken by different campuses, complementing what will emerge from the “role models” project.
Based on the initial data, the researchers and NBCUniversal will choose two campuses to participate in the pilot phase of the Campus Online Education Initiative (which I’ll describe next). In advance of that pilot, the researchers will gather data from a sample of students on each campus, asking about their attitudes toward and use of illicit and legitimate online sources for music, movies, and video. They’ll then repeat that data collection after the pilot term.
Campus Online Entertainment Initiative
Last but least in neither ambition nor complexity, we’re crafting a program that will attempt to address both goals I listed earlier: encouraging campuses to take effective steps to reduce distribution of infringing material from their networks, and helping students to appreciate (and eventually prefer) legitimate sources for online entertainment.
 Working with Universal Studios and some of its peers, we’ll encourage students on participating campuses to use legitimate sources by making a wealth of material available coherently and attractively—through a single source that works across diverse devices, and at a substantial discount or with similar incentives.
Participating campuses, in turn, will maintain or implement policies and practices likely to shrink the volume of infringing material available from their networks. In some cases the participating campuses will already be like those in the “role models” group; in others they’ll be “high volume” or other campuses willing to adopt more effective practices.
I’m managing these projects from NBCUniversal’s Washington offices, but with substantial collaboration from company colleagues here, in Los Angeles, and in New York; from Comcast colleagues in Philadelphia; and from people in other companies. Interestingly, and to my surprise, pulling this all together has been much like managing projects at a research university. That’s a good segue to the next question.
Is it different on the dark side?
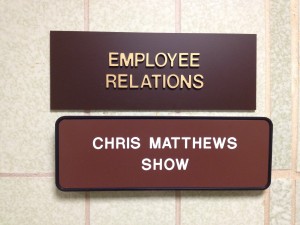 Newly hired, I go out to WRC, the local NBC affiliate in Washington, to get my NBCUniversal ID and to go through HR orientation. Initially it’s all familiar: the same ID photo technology, the same RFID keycard, the same ugly tile and paint on the hallways, the same tax forms to be completed by hand.
But wait: Employee Relations is next door to the (now defunct) Chris Matthews Show. And the benefits part of orientation is a video hosted by Jimmy Fallon and Brian Williams. And there’s the possibility of something called a “bonus”, whatever that is.
Around my new office, in a spiffy modern building at 300 New Jersey Avenue, everyone seems to have two screens. That’s just as it was in higher-education IT. But wait: here one of them is a TV. People watch TV all day as they work.
Toto, we’re not in higher education any more.
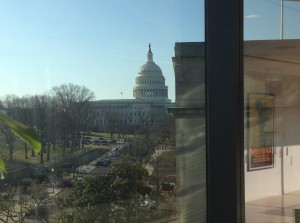 It’s different over here, and not just because there’s a beautiful view of the Capitol from our conference rooms. Certain organizational functions seem to work better, perhaps because they should and in the corporate environment can be implemented by decree: HR processes, a good unified travel arrangement and expense system, catering, office management. Others don’t: there’s something slightly out of date about the office IT, especially the central/individual balance and security, and there’s an awful lot of paper.
Some things are just different, rather than better or not: the culture is heavily oriented to face-to-face and telephone interaction, even though it’s a widely distributed organization where most people are at their desks most of the time. There’s remarkably little email, and surprisingly little use of workstation-based videoconferencing. People dress a bit differently (a maitre d’ told me, “that’s not a Washington tie”).
But differences notwithstanding, mostly things feel much the same as they did at EDUCAUSE, UChicago, and MIT.
 Where I work is generally happy, people talk to one another, gossip a bit, have pizza on Thursdays, complain about the quality of coffee, and are in and out a lot. It’s not an operational group, and so there’s not the bustle that comes with that, but it’s definitely busy (especially with everyone around me working on the Comcast/Time Warner merger). The place is teamly, in that people work with one another based on what’s right substantively, and rarely appeal to authority to reach decisions. Who trusts whom seems at least as important as who outranks whom, or whose boss is more powerful. Conversely, it’s often hard to figure out exactly how to get something done, and lots of effort goes into following interpersonal networks. That’s all very familiar.
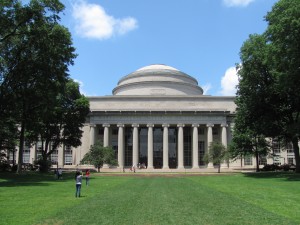 I’d never realized how much like a research university a modern corporation can be. Where I work is NBCUniversal, which is the overarching corporate umbrella (“Old Main”, “Mass Hall”, “Building 10”, “California Hall”, “Boulder”) for 18 other companies including news, entertainment, Universal Studios, theme parks, the Golf Channel, Telemundo (which are remarkably like schools and departments in their varied autonomy).
Meanwhile NBCUniversal is owned by Comcast—think “System Central Office”. Sure, these are all corporate entities, and they have concrete metrics by which to measure success: revenue, profit, subscribers, viewership, market share. But the relationships among organizations, activities, and outcomes aren’t as coherent and unitary as I’d expected.
Dark or Green?
So, am I on the dark side, or have I left it behind for greener pastures? Curiously, I hear both from my friends and colleagues in higher education: Some of them think my move is interesting and logical, some think it odd and disappointing. Curioser still, I hear both from my new colleagues in the industry: Some think I was lucky to have worked all those decades in higher education, while others think I’m lucky to have escaped. None of those views seems quite right, and none seems quite wrong.
The point, I suppose, is that simple judgments like “dark” and “greener” underrepresent the complexity of organizational and individual value, effectiveness, and life. Broad-brush characterizations, especially characterizations embodying the ecological fallacy, “…the impulse to apply group or societal level characteristics onto individuals within that group,” do none of us any good.
It’s so easy to fall into the ecological-fallacy trap; so important, if we’re to make collective progress, not to.
Comments or questions? Write me: greg@gjackson.us
(The quote is from Charles Ess & Fay Sudweeks, Culture, technology, communication: towards an intercultural global village, SUNY Press 2001, p 90. Everything in this post, and for that matter all my posts, represents my own views, not those of my current or past employers, or of anyone else.)
3|5|2014 11:44a est
 I’m at loose ends after graduating. The Dean for Student Affairs, whom I’ve gotten to know through a year of complicated political and educational advocacy, wants to know more about MIT‘s nascent pass/fail experiment, under which first-year students receive written rather than graded evaluations of their work.
 A byproduct of the assignment is my first exposure to MIT’s glass-house computer facility, an IBM 360 located in the then-new Building 39. In due course I learn that Jay Forrester, an MIT faculty member, had patented the use of 3-D arrays of magnetic cores for computer memory (the read-before-write use of cores, which enabled Forrester’s breakthrough, had been patented by An Wang, another faculty member, of the eponymous calculators and word processors). IBM bought Wang’s patent, but not Forrester’s, and after protracted legal action eventually settled with Forrester in 1964 for $13-million.
 I’m having lunch with a very smart, experienced, and impressive senior officer from an entertainment-industry association, whom I’ll call Stan. The only reason universities invest heavily in campus networks, Stan tells me, is to enable students to download and share ever more copyright-infringing movies, TV shows, and music. That’s why campuses remain major distributors of “pirated” entertainment, he says, and therefore why it’s appropriate to subject higher education generally to regulations and sanctions such as the “peer to peer” regulations from the 2008 Higher Education Opportunity Act.
 First, shortly after MPAA asserted, both publicly and in letters to campus presidents, that 44% of all copyright infringement emanates from college campuses, which is where Stan’s “almost half” comes from, MPAA learned that its data contractor had made a huge arithmetic error. The correct estimate should have been more like 10-15%. But the corrected estimate was never publicized as extensively as the erroneous one: the errors that statisticians make live after them; the corrections are oft interred with their bones.
 I’m having dinner with the CIO from an eminent research university; I’ll call her Samantha, and her campus Helium (the same name it has in the infringement-data post I cited above). We’re having dinner just as I’m completing my 2013 study, in which Helium has surpassed Hydrogen as the largest campus distributor of copyright-infringing movies, TV shows, and music.
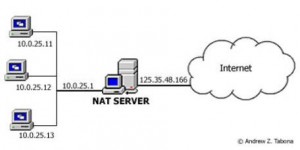 As in Stan’s case, it helps to know something about how campus networks work. Lots of traffic distributed evenly across a small number of IP addresses sounds an awful lot like load balancing, so perhaps those addresses are the front end to some large group of users. “Front end to some large group of users” sounds like an internal network using Network Address Translation (NAT) for its external connections.
 Since then, however, the industry had changed its methodology, in large part because the BitTorrent protocol replaced earlier ones as the principal medium for download-based infringement. Because of how BitTorrent works, the industry’s methodology shifted from searching particular networks to searching BitTorrent indexes for particularly popular titles and then seeing which networks were making those titles available.
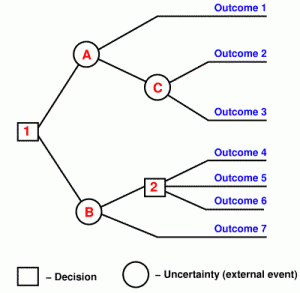 A key tenet in decision analysis holds that information has no value (other than the intrinsic value of knowledge) unless the decisions an individual or an institution have before them will turn out differently depending on the information. That is, unless decisions depend on the results of data analysis, it’s not worth collecting or analyzing data.

