Posts Tagged ‘dmca’

Mythology, Belief, Analytics, & Behavior

MIT_Building_10_and_the_Great_Dome,_Cambridge_MAI’m at loose ends after graduating. The Dean for Student Affairs, whom I’ve gotten to know through a year of complicated political and educational advocacy, wants to know more about MIT‘s nascent pass/fail experiment, under which first-year students receive written rather than graded evaluations of their work.

MIT being MIT, “know more” means data: the Dean wants quantitative analysis of patterns in the evaluations. I’m hired to read a semester’s worth, assign each a “Usefulness” score and a “Positiveness” score, and then summarize the results statistically.

Two surprises. First, Usefulness turns out to be much higher than anyone had expected–mostly because evaluations contain lots of “here’s what you can do to improve” advice, rather than lots of terse “you would have gotten a B+” comments, as had been predicted. Second, Positiveness distributes remarkably as grades had for the pre-pass/fail cohort, rather than skewing higher, as had been predicted. Even so, many faculty continue to believe both predictions (that is, they think written evaluations are both generally useless and inappropriately positive).

20120502161716-1_0A byproduct of the assignment is my first exposure to MIT’s glass-house computer facility, an IBM 360 located in the then-new Building 39. In due course I learn that Jay Forrester, an MIT faculty member, had patented the use of 3-D arrays of magnetic cores for computer memory (the read-before-write use of cores, which enabled Forrester’s breakthrough, had been patented by An Wang, another faculty member, of the eponymous calculators and word processors). IBM bought Wang’s patent, but not Forrester’s, and after protracted legal action eventually settled with Forrester in 1964 for $13-million.

According to MIT mythology, under the Institute’s intellectual-property policy half of the settlement came to the Institute, and that money built Building 39. Only later do I wonder whether the Forrester/IBM/39 mythology is true. But not for long: never let truth stand in the way of a good story.

Not just because mythology often involves memorable, simple stories, belief in mythology is durable. This is important because belief so heavily drives behavior. That belief resists even data-driven contradiction–data analysis rarely yields memorable, simple stories–is one reason analytics so often prove curiously ineffective in modifying institutional behavior.

Two examples, both involving the messy question of copyright infringement by students and what, if anything, campuses should do about it.

44%

laurelI’m having lunch with a very smart, experienced, and impressive senior officer from an entertainment-industry association, whom I’ll call Stan. The only reason universities invest heavily in campus networks, Stan tells me, is to enable students to download and share ever more copyright-infringing movies, TV shows, and music. That’s why campuses remain major distributors of “pirated” entertainment, he says, and therefore why it’s appropriate to subject higher education generally to regulations and sanctions such as the “peer to peer” regulations from the 2008 Higher Education Opportunity Act.

That Stan believes this results partly from a rhetorical problem with high-performance networks, such as the research networks within and interconnecting colleges and universities. High-performance networks–even those used by broadcasters–usually are engineered to cope with peak loads. Since peaks are occasional, most of the time most network capacity goes unused. If one doesn’t understand this–as Stan doesn’t–then one assumes that the “unused” capacity is in fact being used, but for purposes not being disclosed.

And, as it happens, there’s mythology to fill in the gap: According to a 2005 MPAA study, Stan tells me, higher education accounts for almost half of all copyright infringement. So MPAA, and therefore Stan, knows what campuses aren’t telling us: they’re upgrading campus networks to enable infringement.

But Stan is wrong. There are two big problems with his belief.

MPAAFirst, shortly after MPAA asserted, both publicly and in letters to campus presidents, that 44% of all copyright infringement emanates from college campuses, which is where Stan’s “almost half” comes from, MPAA learned that its data contractor had made a huge arithmetic error. The correct estimate should have been more like 10-15%. But the corrected estimate was never publicized as extensively as the erroneous one: the errors that statisticians make live after them; the corrections are oft interred with their bones.

Second, if Stan’s belief is correct, then there should be little difference among campuses in the incidence of copyright infringement, at least among campuses with research-capable networking. Yet this isn’t the case. As I’ve found researching three years of data on the question, the distribution of detected infringement is highly skewed. Most campuses are responsible for little or no distribution of infringing material, presumably because they’re using Packetlogic, Palo Alto firewalls, or similar technologies to manage traffic. Conversely, a few campuses account for the lion’s share of detected infringement.

So there are ample data and analytics contradicting Stan’s belief, and none supporting it. But his belief persists, and colors how he engages the issues.

Targeting

imagesOKVW44NDI’m having dinner with the CIO from an eminent research university; I’ll call her Samantha, and her campus Helium (the same name it has in the infringement-data post I cited above). We’re having dinner just as I’m completing my 2013 study, in which Helium has surpassed Hydrogen as the largest campus distributor of copyright-infringing movies, TV shows, and music.

In fact, Helium accounts for 7% of all detected infringement from the 5,000 degree-granting colleges and universities in the United States. I’m thinking that Samantha will want to know this, that she will try to figure out what Helium is doing–or not doing–to stand out as such a sore thumb among peer campuses, and perhaps make some policy or practice changes to bring Helium into closer alignment.

But no: Samantha explains to me that the data are entirely inaccurate. Most of the infringement notices Helium receives are duplicates, she tells me, and in any case the only reason Helium receives so many is that the entertainment industry intentionally targets Helium in its detection and notification processes. Since the data are wrong, she says, there’s no need to change anything at Helium.

I offer to share detailed data with Helium’s network-security staff so that they can look more closely at the issue, but Samantha declines the offer. Nothing changes, and in 2014 Helium is again one of the top recipients of infringement notices (although Hydrogen regains the lead it had held in 2012).

The data Samantha declines to see tell an interesting story, though. The vast majority of Helium’s notices, it turns out, are associated with eight IP addresses. That is, each of those eight IP addresses is cited in hundreds of notices, which may account for Samantha’s comment about “duplicates”. Here’s what’s interesting: the eight addresses are consecutive, and they each account for about the same number of notices. That suggests technology at work, not individuals.
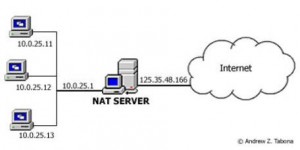
image0021083244899217As in Stan’s case, it helps to know something about how campus networks work. Lots of traffic distributed evenly across a small number of IP addresses sounds an awful lot like load balancing, so perhaps those addresses are the front end to some large group of users. “Front end to some large group of users” sounds like an internal network using Network Address Translation (NAT) for its external connections.

NAT issues numerous internal IP addresses to users, and then technologically translates those internal addresses traceably into a much smaller set of external addresses. Most campuses use NAT to conserve their limited allocation of external IP addresses, especially for their campus wireless networks. NAT logs, if kept properly, enable campuses to trace connections from insiders to outside and vice versa, and so to resolve those apparent “duplicates”.

So although it’s true that there are lots of duplicate IP addresses among the notices Helium receives, this probably stems from Helium’s use of NAT on its campus wireless. Helium’s data are not incorrect. If Helium were to manage NAT properly, it could figure out where the infringement is coming from, and address it.

Samantha’s belief that copyright holders target specific campuses, like Stan’s that campuses expand networks to encourage infringement, has a source–in this case, a presentation some years back from an industry association to a group of IT staff from a score of research universities. (I attended this session.) Back then, we learned, the association did target campuses, not out of animus, but simply as a data-collection mechanism. The association would choose a campus, look for infringing material being published from the campus’s network, send notices, and then move on to another campus.

utorrent-facebook-mark-850-transparentSince then, however, the industry had changed its methodology, in large part because the BitTorrent protocol replaced earlier ones as the principal medium for download-based infringement. Because of how BitTorrent works, the industry’s methodology shifted from searching particular networks to searching BitTorrent indexes for particularly popular titles and then seeing which networks were making those titles available.

I spent lots of time recently with the industry’s contractors looking closely at that methodology. It appears to treat campus networks equivalently to each other and to commercial networks, and so it’s unlikely that Helium was being targeted as Samantha asserted.

If Samantha had taken the infringement data to her security staff, they probably would have discovered the same thing I did, and either used NAT data to identify offenders, or perhaps to justify policy changes for the wireless network. Same goes for exploring the methodology. But instead Samantha relied on her belief that the data were incorrect and/or targeted

Promoting Analytic Effectiveness

Because of Stan’s and Samantha’s belief in mythology, their organizations’ behavior remains largely uninformed by analytics and data.
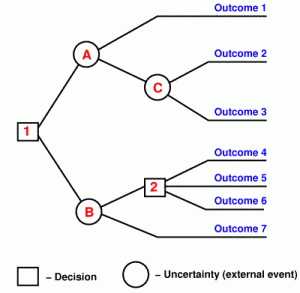
decision-treeA key tenet in decision analysis holds that information has no value (other than the intrinsic value of knowledge) unless the decisions an individual or an institution have before them will turn out differently depending on the information. That is, unless decisions depend on the results of data analysis, it’s not worth collecting or analyzing data.

Colleges, universities, and other academic institutions have difficulty accepting this, since the intrinsic value of information is central to their existence. But what’s valuable intrinsically isn’t necessarily valuable operationally.

Generic praise for “data-based decision making” or “analytics” won’t change this. Neither will post-hoc documentation that decisions are consistent with data. Rather, what we need are good, simple stories that will help mythology evolve: case studies of how colleges and universities have successfully and prospectively used data analysis to change their behavior for the better. Simply using data analysis doesn’t suffice, and neither does better behavior: we need stories that vividly connect the two.

Ironically, the best way to combat mythology is with–wait for it–mythology…

Revisiting IT Policy #2: Campus DMCA Notices

Under certain provisions from the Digital Millennium Copyright Act, copyright holders send a “notification of claimed infringement” (sometimes called a “DMCA” or “takedown” notice) to Internet service providers, such as college or university networks, when they find infringing material available from the provider’s network. I analyzed counts of infringement notices from the four principal senders to colleges and universities over three time periods (Nov 2011-Oct 2012, Feb/Mar 2013, and Feb/Mar 2014).

In all three periods, most campuses received no notices, even campuses with dormitories. Among campuses receiving notices, the distribution is highly skewed: a few campuses account for a disproportionately large fraction of the notices. Five campuses consistently top the distribution in each year, but beyond these there is substantial fluctuation from year to year.

The volume of notices sent to campuses varies somewhat positively with their size, although some important and interesting exceptions keep the correlation small. The incidence of detected infringement varies strongly with how residential campuses are. It varies less predictably with proxy measures of student-body affluence.

I elaborate on these points below.

Patterns

The estimated total number of notices for the twelve months ending October 2012 was 243,436. The actual number of notices in February/March 2013 was 39,753, and the corresponding number a year later was 20,278.

The general pattern was the same in each time period.

  • According to the federal Integrated Postsecondary Education Data Service (IPEDS), from which I obtained campus attributes, there are 4,904 degree-granting campuses in the United States. Of these, over 80% received no infringement notices in any of the three time periods.
  • 90% of infringement notices went to campuses with dormitories.
  • Of the 801 institutions that received at least one notice in one period, 607 received at least one notice in two periods, and 437 did so in all three. The distribution was highly skewed among the campuses that received at least one infringement notice. The top two recipients in each period were the same: they alone accounted for 12% of all notices in 2012, and 10% in 2013 and 2014.
  • In 2012, 10 institutions accounted for a third of all notices, and 41 accounted for two thirds. In 2013, the distribution was only a little less skewed: 22 institutions accounted for a third of all notices, and 94 accounted for two thirds. In 2014, 22 institutions also accounted for a third of all notices, and 99 accounted for two thirds.

Campus Type

In 2014, just 590 of the 4,904 campuses received infringement notices in 2014. Here is a breakdown by institutional control and type:

Capture

Here are the same data, this time broken down by campus size and residential character (using dormitory beds per enrolled student to measure the latter; the categories are quintiles):

Capture2

About a third of all notices went to very large campuses in the middle residential quintile. In keeping with the classic Pareto ratio, the largest 20% of campuses account for 80% of all notices (and enroll ¾ of all students). Although about half of the largest group is nonresidential (mostly community colleges, plus some state colleges), only a few of them received notices.

Campus Distributions

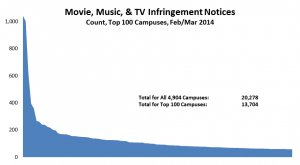
The top two among the 100 campuses that received the most notices in Feb/Mar 2014 received over 1,000 notices each in the two months. The next highest campus received 615. As the graph below shows, the top 100 campuses accounted for two thirds of the notices; the next 600 campuses accounted for the remaining third (click on this graph, or the others below, to see it full size):

image001

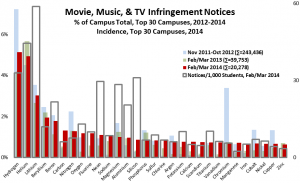
Below is a more detailed distribution for the top 30 recipient campuses, with comparisons to 2012 and 2013 data. To enable valid comparison, this chart shows the fraction of notices received by each campus in each year, rather than the total. The solid red bars are the campus’s 2014 share, and the lighter blue and green bars are the 2012 and 2013 shares. The hollow bar for each campus is the incidence of detected infringement, defined as the number of 2014 notices per thousand headcount students.

image003

As in earlier analyses, there is an important distinction between campuses whose high volume of notices stems largely from their size, and those where it stems from a combination of size and incidence—that is, the ratio of notices received to enrollment.

In the graph, Carbon and Nitrogen are examples of the former: they are both very large public urban universities enrolling over 50,000 students, but with relatively low incidence of around 7 notices per thousand students. They stand in marked contrast to incidences of 20-60 notices per thousand students at Lithium, Boron, Neon, Magnesium, Aluminum, and Silicon, each of which enrolls 10-25,000 students—all private except Aluminum.

Changes over Time

The overall volume of infringement notices varies from time to time depending on how much effort copyright holders devote to searching for infringement (effort costs money), and to a lesser extent based on which titles they use to seed searches. The volume of notices sent to campuses varies accordingly. However, the distribution of notices across campuses should not be affected by the total volume. To analyze trends, therefore, it is important to use a metric independent of total volume.

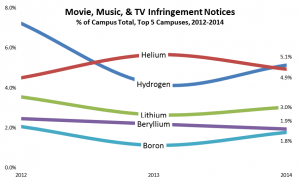
As in the preceding section, I used the fraction of all campus notices each campus received for each period. The top two campuses were the same in all three years: Hydrogen was highest in 2012 and 2014, and Helium was highest in 2013.

Only five campuses received at least 1.5% of all notices in more than one year:

image005

These campuses consistently stand at the top of the list, account for a substantial fraction of all infringement notices, and except for Beryllium have incidence over 20. As I argue below, it makes sense for copyright holders to engage them directly, to help them understand how different they are from their peers, and perhaps to persuade them to better “effectively combat” infringement from their networks by adopting policies and practices from their low-incidence peers.

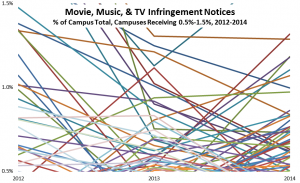
Aside from these five campuses, there is great year-to-year variation in how many notices campuses receive. Below, for example, is a similar graph for the approximately 50 campuses receiving 0.5%-1.5% of all notices in at least one of the three years. Such year-to-year variation makes engagement much more difficult to target efficiently and much less likely to have discernible effects.

image007

Relationships

Size

All else equal, if infringement is the same across campuses and campuses take equally effective measures to prevent it from reaching the Internet, then the volume of detected infringement should generally vary with campus size. That this is only moderately the case implies that student behavior varies from campus to campus and/or that campuses’ “effectively combat” measures are different and have different effects.

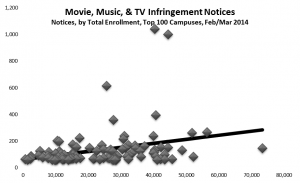
Here are data for the 100 campuses receiving the most infringement notices in 2014:

image009

It appears visually that the overall correlation between campus size and notice volume is modest (and indeed r=0.29) because such a large volume of notices went to Hydrogen and Helium, which are not the largest campuses.

However, the correlation is slightly lower if those two campuses are omitted. This is because Lithium has the next highest volume, yet is of average size, and Manganese, the largest campus in the group, with over 70,000 students, had very low incidence of 2 notices per thousand students. (I’ve spoken at length with the CIO and network-security head at Manganese, and learned that its anti-infringement measures comprise a full array of policies and practices: blocking of peer-to-peer protocols at the campus border, with well-established exception procedures; active followthrough on infringement notices received; and direct outreach to students on the issue.)

Residence

If students live on campus, then typically their network connection is through the campus network, their detectable infringement is attributed to the campus, and that’s where the infringement notice goes. If students live off campus, then they do not use the campus network, and infringement notices go to their ISP. This is why most infringement notices go to campuses with dorms, even though the behavior of their students probably resembles that of their nonresidential peers.

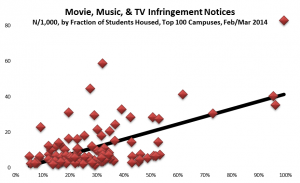
For the same reason, we might expect that residentially intensive campuses (measured by the ratio of dormitory beds to total enrollment) would have a higher incidence of detectable infringement, all else equal, than less residential campuses. Here are data for the 100 campuses receiving the most infringement notices:

image011

The relationship is positive, as expected, and relatively strong (r=.58). It’s important, though, to remember that this relationship between campus attributes (residential intensity and the incidence of detected infringement) does not necessarily imply a relationship between student attributes such as living in dorms and distributing infringing material. Drawing inferences about individuals from data about groups is the “ecological fallacy.”

Affluence

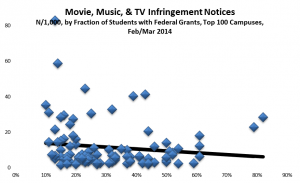
One hears arguments that infringement varies with affluence, that is, that students with less money are more likely to infringe. There’s no way to assess that directly with these data, since they do not identify individuals. However, IPEDS campus data include the fraction of students receiving Federal grant aid, which varies inversely with income. The higher this fraction, the less affluent, on average, the student body should be. So it’s interesting to see how infringement (measured by incidence rather than volume) varies with this metric:

image013

The relationship is slightly negative (r=-.12), in large part because of Polonium, a small private college with few financial-aid recipients that received 83 notices per 1000 students in 2014. (Its incidence was similar in 2012, but much lower in 2013.) Even without Polonium, however, the relationship is small.

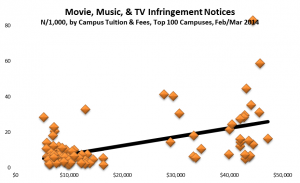
For the same reason, we might expect a greater incidence of detected infringement on less expensive campuses. The data:

image015

Once again the relationship is the opposite (r=.54), largely because most campuses have both low tuition and low incidence.

Campus Interactions

Following the 2012 and 2013 studies, I communicated directly with IT leaders at several campuses with especially high volumes of infringement notices. All save one (Hydrogen) of these interactions were informative, and several appear to have influenced campus policies and practices for the better.

  • Helium. Almost all of Helium’s notices are associated with a small, consecutive group of IP addresses, presumably the external addresses for a NAT-mediated campus wireless network. I learned from discussions with Helium’s CIO that the university does not retain NAT logs long enough to identify wireless users when infringement notices are received; as a result, few infringement notices reach offenders, and so they have little impact directly or indirectly. Helium apparently understands and recognizes the problem, but replacing its wireless logging systems is not a high priority project.
  • Hydrogen. Despite diverse direct, indirect, and political efforts to engage IT leaders at Hydrogen, I was never able to open discussions with them. I do not understand why the university receives so many notices (unlike Helium’s, they are not concentrated), and was therefore unable to provide advice to the campus. It is also unclear whether the notices sent to Hydrogen are associated with its small-city main campus or with its more urban branch campus.
  • Krypton. Krypton used to provide guests up to 14 days of totally unrestricted and anonymous use of its wired and wireless networks. I believe that this led to its high rate of detected infringement. More recently, Krypton implemented a separate guest wireless network, which is still anonymous but apparently is either more restricted or is routed to an external ISP. I believe that this change is why Krypton is no longer in the top 20 group in 2014. (Krypton still offers unrestricted 14-day access to its wired network.)
  • Lithium. The network-security staff at Lithium told me that there are plans to implement better filtering and blocking on their network, but that implementation has been delayed.
  • Nitrogen. Nitrogen enrolls over 50,000 students, more than almost any other campus. As I pointed out above, although Nitrogen’s infringement notice counts are substantial, they are actually relatively low when adjusted for enrollment.
  • Gallium. I discussed Gallium’s high infringement volume with its CIO in early 2013. She appeared to be surprised that the counts were so high, and that they were not all associated with Gallium affiliate campuses, as the university had previously believed. Although the CIO was noncommittal about next steps, it appears that something changed for the better.
  • Palladium. The Palladium CIO attended a Symposium I hosted in March 2013, and while there he committed to implementing better controls at the University. The CIO appears to have followed through on this commitment.
  • No Alias. Although it doesn’t appear in the graph, No Alias is an interesting story. It ranked very high in the 2012 study. NA, it turns out, provides exit connections for the Tor network, which means that some traffic that appears to originate at NA in fact originates from anonymous users elsewhere. Most of NA’s 2012 notices were associated with the Tor connections, and I suggested to NA’s security officer that perhaps No Alias might impose some modest filters on those. It appears that this may have happened, and may be why NA dropped out of the top group.

I also interacted with several other campuses that ranked high in 2013. In many of these conversations I was able to point IT staff to specific problems or opportunities, such as better configuring firewalls. Most of these campuses moved out of the top group.

And So…

The 2014 DMCA notice data reinforce earlier implications (from both data and direct interactions) for campus/industry interactions. Copyright holders should interact directly with the few institutions that rank consistently high, and with large residential institutions that rank consistently low. In addition, copyright holders should seek opportunities to better understand how best to influence student behavior, both during and after college.

Conversely, campuses that receive disproportionately many notices, and so give higher education a bad reputation with regard to copyright infringement, should consult peers at the other end of the distribution, and identify reasonable ways to improve their policies and practices.

9|4|14 gj-c


Story of S, and the Mythology of the Lost Generation

argo_ver7_xlgDinner talk turned from Argo and Zero Dark Thirty to movies more generally. A 21-year-old college senior—I’ll call her “S”—recognized most of the films we were discussing. She had seen several, but others she hadn’t, which was a bit surprising, since S was an arts major, wanted to be a screenwriter, and was enthusiastic about her first choice for graduate school: the screenwriting program at a major California institution focused on the movie industry.

S had older brothers in the movie business, and she already had begun writing. What she needed, S said, was broader and deeper exposure to what made good screenplays. Graduate school would provide “deeper.” Her plan for “broader” was to watch as many well-regarded classics as possible, and apparently we were helping her map out that strategy.

But many of the films she wanted to see weren’t available on cable in her dormitory, even as pay-per-view. “Buying” or “renting” them online she found too expensive and awkward, especially given the number of films she wanted to see. So S was doing what unfortunately many students (and others) do: looking for movies on the Internet, and then streaming or downloading the least expensive version she could find. Since S’s college dormitory provided good Internet connectivity, S used that to download or stream her movies. Bluebeard_PirateUsually, she said, the least expensive version was an unauthorized copy, a so-called “pirate” version.

Some of us challenged her: Didn’t S realize that downloading or streaming “pirated” copies was against the law? Was she not concerned about the possible consequences? As a budding screenwriter, would she want others to do as she was doing, and deprive her of royalties? Didn’t it just seem wrong to take something without the owner’s permission?

S listened carefully—she was pretty sharp—but she didn’t seem convinced. Indeed, she seemed to feel that her choice to use unauthorized copies was reasonable, given the limited and unsatisfactory alternatives provided by the movie industry.

cary-shermanIn so believing, S was echoing the persistent mythology of the lost generation. I first heard Cary Sherman, the President of the Recording Industry Association of America (RIAA), use “the lost generation” to describe the approximately 25 million students who became digital consumers between two milestones: Napster‘s debut in 1999, which made sharing of MP3s ripped from CDs easy, and Apple’s discontinuing digital rights management (DRM) for most iTunes music in 2009, which made buying tracks legally almost as easy and convenient.

Even without the illusion that infringing materials were “free,” there were ample incentives to infringe during that period: illegal mechanisms were comprehensive and easy to use, for the most part, whereas legal mechanisms did not exist, were inflexible and awkward, and/or did not include many widely-desired items.

Age_of_Mythology_LinerBecause of this, many members of the lost generation adopted a mythology comprising some subset of

  • digital materials are priced too high, since it costs money to manufacture CDs and DVDs but the Internet is free,
  • profits flow to middlemen rather than artists, and so artists aren’t hurt by infringement,
  • DRM is just the industry’s mechanism for controlling users and rationing information,
  • people who stream or download unauthorized copies wouldn’t have bought legal copies anyway, and so copyright holders don’t lose any revenue because of unauthorized copying,
  • there’s no way to sample material before buying it, and so unauthorized sources are the only easy way to explore new or arcane stuff,
  • the entertainment  industry has no interest in serving customers, as evidenced by its keeping so much material unavailable,
  • copyright is wrong, since information should be free and users should just pay what they think it’s worth, and
  • (the illegitimate moral leap S and others make) therefore it’s “okay” to copy and share digital materials without permission.

Unfortunately, the lost generation’s beliefs, most of which have always been exaggerated or invalid, have been passed down to successor generations, a process accelerated rather than slowed by the current industry emphasis on monitoring and penalizing network users.

cool-hand-luke-martinWhy does the mythology persist?

There are the obvious technical and financial arguments: if illegal technology is more convenient that legal, and illegal content costs less than legal, then it’s not surprising that illegal stuff remains prominent.

But in addition, as the Captain might observe, what we have here is failure to communicate:

  • There’s lots of evidence that convenient, comprehensive services like Netflix, Amazon Prime Instant Video, Hulu, Pandora, and Spotify draw users to them even when there are illegal “free” alternatives. But for this to happen, users must know about those services. S clearly didn’t—we asked her specifically—and that’s a marketing failure.
  • Shoplifting and plagiarism are relatively rare, at least among individuals like S. Yet they have the same appealing features as “pirate” music and video. Somehow S and her peers have come to understand that shoplifting, plagiarism, and various similar choices are unethical, immoral, or socially counterproductive. Yet they don’t put copyright infringement in the same category. That’s a social, educational, and parental failure.
  • LSb_120504_345.jpgFor all kinds of arguably irremediable licensing, contractual, competitive, and anti-trust reasons, it remains stubbornly difficult to “give the lady what she wants“: in S’s case, a comprehensive, reasonably priced, convenient service from which she could obtain all the movies she wanted. Whether this is customers not conveying their wants to providers (in part because they can bypass the latter), or whether this is providers stuck on obsolete delivery models, it’s a business failure.
  • Colleges and universities are supposed at least to tell their students about copyright infringement, and to implement technologies and other mechanisms to “effectively combat” it. S had no idea that the consequences of being caught downloading or streaming unauthorized copies were anything beyond being told to stop. So far as she knew, no one, at least no one at her college, had ever gotten in trouble for that. And she’d never heard anything from her college—which was also her Internet service provider—about the issue. That’s a policy failure.

To be fair, S’s dinner comments endorsed only a small subset of the lost generation’s tenets, she seemed generally interested in the streaming services we told her about, and she was now thinking about the consequences of being caught downloading or streaming unauthorized copies—and about how lots of people doing that might affect her future earnings. So there was progress.

But ganging up on 21-year-olds at dinner parties is a very inefficient way to counteract the mythology of the lost generation. We—and by this I mean everyone: users, parents, schools, artists, producers, network providers—need  to find much better ways to communicate about copyright infringement, to help potential infringers understand the choices they are making, and to provide and use better legal services.

Especially until we do that last, this will be hard, and progress will be slow. But it’s progress we need if the intellectual-property economy is to endure.